In this guide
- Look at funnel, products, channels, cohorts and creatives, and check each against orders.
- Add profit to every view. Revenue-only reports reward the wrong things.
- Use a weekly review with one decision per meeting.
A store dashboard can show hundreds of numbers. Five views answer most of the questions that matter. This page describes them, what to look for in each and how to turn them into a weekly routine. It uses the KPIs in e-commerce KPIs and the data practices in digital marketing analytics.
1. The funnel
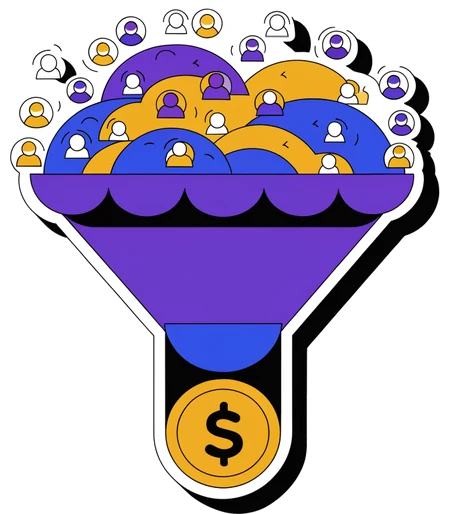
Sessions to product views to add to cart to checkout to purchase. Look for the step with the biggest drop and compare it by device and by source. A weak add-to-cart rate suggests a product page problem. A drop at checkout suggests shipping costs, payment options or errors.
Brands that grow on cleaner data
Stores and agencies use Open Tracked to see which ads earn the sale.




















2. Products
Revenue, units, margin and return rate by product. Sort by profit, not revenue. A top seller with a 10 percent margin and many returns may deserve less promotion than a quieter product with a 50 percent margin.
3. Channels
| Channel | Look at | Watch out for |
|---|---|---|
| Paid social | Spend, orders, ROAS, new customers, POAS | Platform numbers that differ from your store |
| Paid search | Spend, orders, ROAS, brand versus non-brand | Brand terms that inflate results |
| Revenue per send, unsubscribe rate | Credit that belongs to the first touch | |
| Organic | Sessions, orders, landing pages | Direct traffic that hides other sources |
Ask Ari instead of digging through reports
Ari reads your tracking and ad data and answers in plain words.
4. Cohorts
Group customers by the month of their first order, and follow how much each group spends over time. Cohorts show whether acquisition quality is getting better or worse, and what a customer is really worth after a year. Cohort data needs a stable customer identifier, so connect orders to customers.
5. Creatives
Which ads and creatives bring orders and profit, not only clicks. Compare by spend, cost per purchase and new customers. Retire the losers and make variations of the winners. Open Tracked's analytics includes a creative report alongside acquisition, website, retention, orders, products and finance.
Make the data reliable
- Send purchases from the server with a transaction ID, so no order is lost or doubled.
- Keep click IDs and cookies alive so channels get credit. See Safari ITP.
- Include product cost so profit is real. See profit on ad spend.
- Compare platform revenue with store revenue each week.
A weekly review
- Funnel: any step that moved?
- Products: top five by profit and any with a high return rate.
- Channels: spend, ROAS and POAS.
- Cohorts: has the newest cohort started well?
- Creatives: kill one, scale one.
- Write one decision for the week.
A realistic example
A store reviews its performance and finds that its funnel is healthy until checkout, where one in three visitors drops. Looking at devices, the drop is nearly all on mobile. A look at the checkout shows that the mobile payment button sits below a long address form. The team shortens the form and moves the payment options up, and checkout completion on mobile rises. A product view then shows that its second-best seller has a 20 percent return rate and a thin margin, so it stops promoting that product in ads and moves budget to a product with half the returns. Neither finding needed advanced tools. They came from reading the funnel by device and the product list by profit, and from having data reliable enough to believe.
Raw events in. Clean events out.
Open Tracked collects each event on your own domain, removes the noise and sends what is left to Meta, Google Ads, TikTok.
Frequently asked questions
What should I analyse in an online store?
The funnel, products, channels, cohorts and creatives, each with profit in view.
How often should I review?
Weekly for channels and creatives, monthly for cohorts and margins.
Why add profit to reports?
Revenue-only reports reward high-revenue, low-margin products and campaigns.
How do I make the numbers trustworthy?
Send server-side purchases, keep cookies alive and compare with your store each week.
What does Open Tracked analytics include?
Acquisition, creative, website and retention reports, plus orders, products and finance, on every analytics plan.
Do I need spreadsheets to read my results?
No. Once tracking is live, the Open Tracked analytics shows spend, revenue, ROAS and profit, and you can ask Ari, the built-in AI assistant, questions about your own numbers in plain words. Ari's allowance depends on your analytics plan.
Is Open Tracked different from Open Track or Open Space Track?
No. Open Tracked is the official name of our server-side tracking platform, and the website is opentracked.io. Many people search for it as Open Track, OpenTrack or Open Space Track. All of them lead to the same product: server-side Google Tag Manager hosting, first-party analytics and a CRM pipeline.
Fix your tracking at the source
Open Tracked hosts your server-side Tag Manager, keeps first-party cookies alive and shows what each ad is really worth.

The Open Tracked team
We build Open Tracked: server-side tracking hosting, analytics and the tools around them, for stores that spend on ads. Questions about this guide, or an idea for the next one?
Comments
Loading comments...

 Guides · 6 min read