Revenue, spend and ROAS, side by side
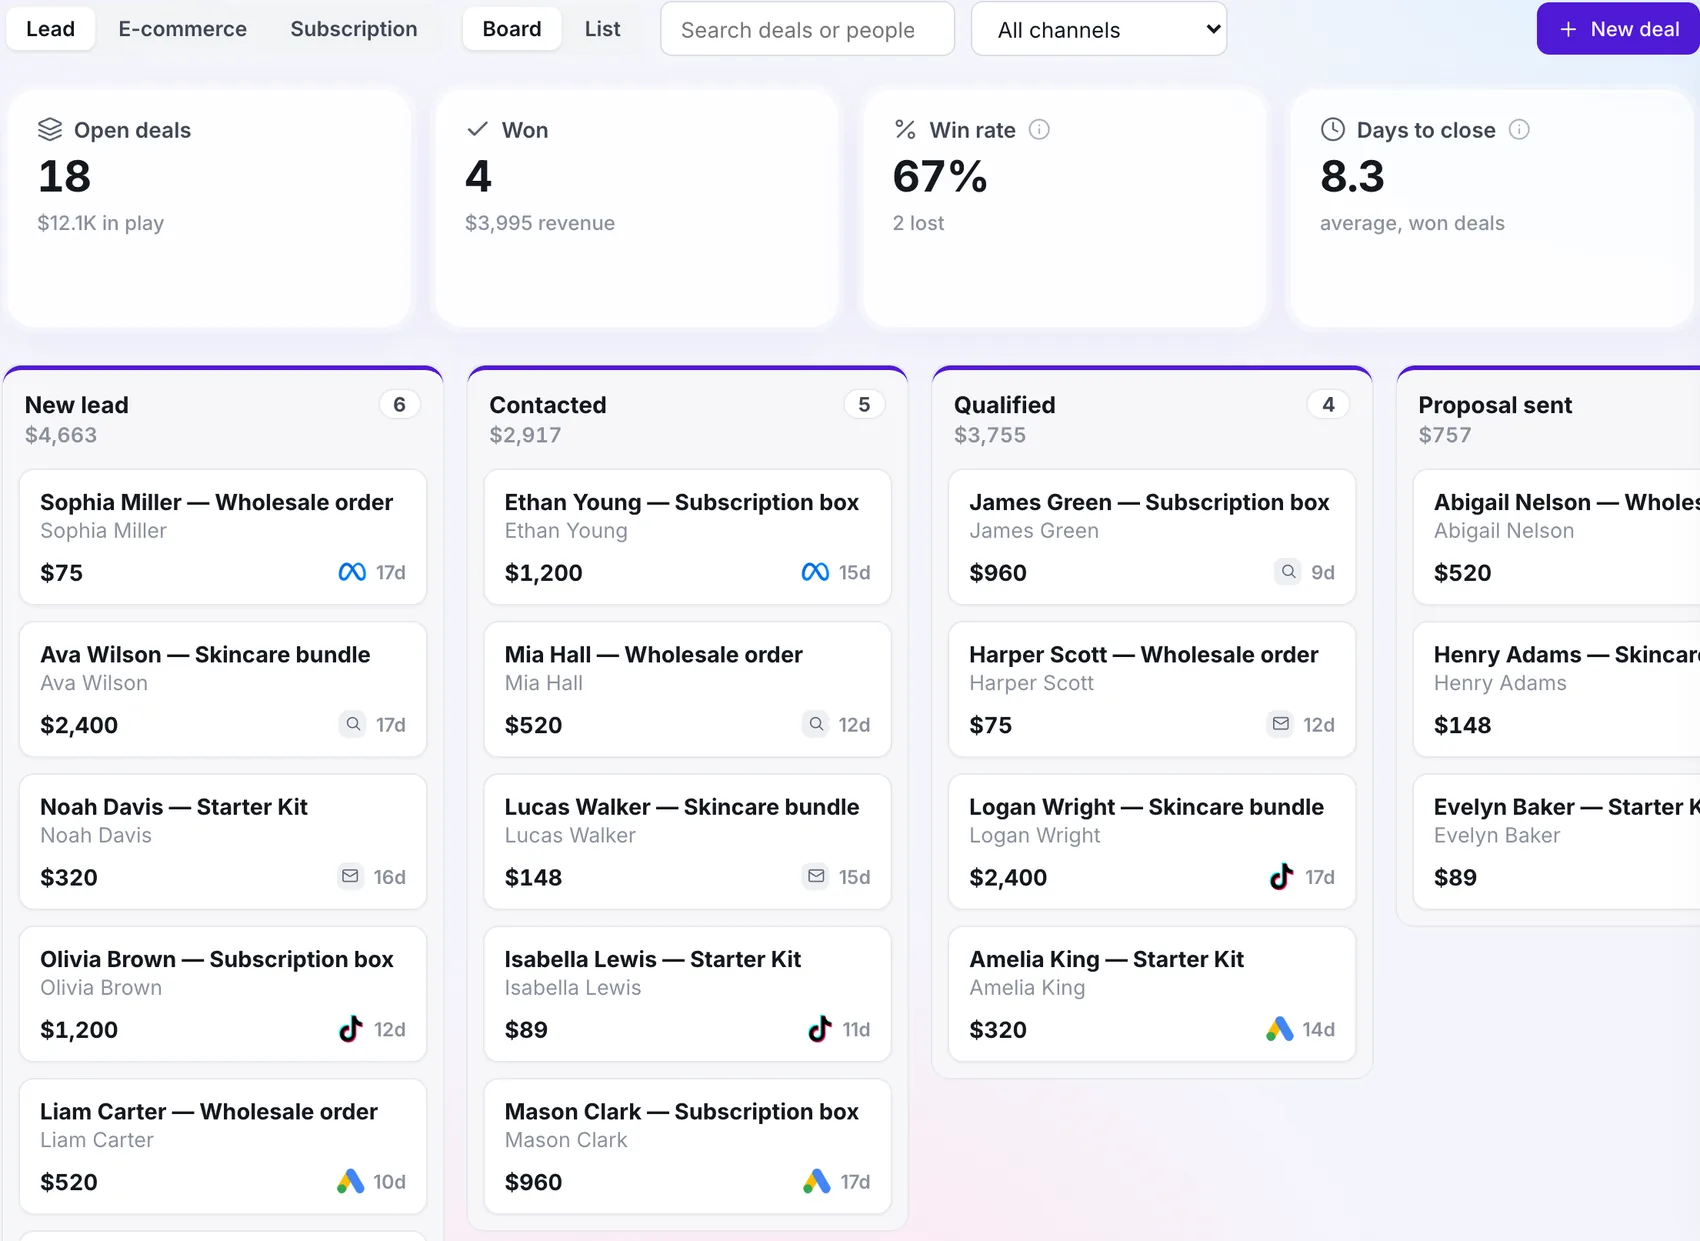
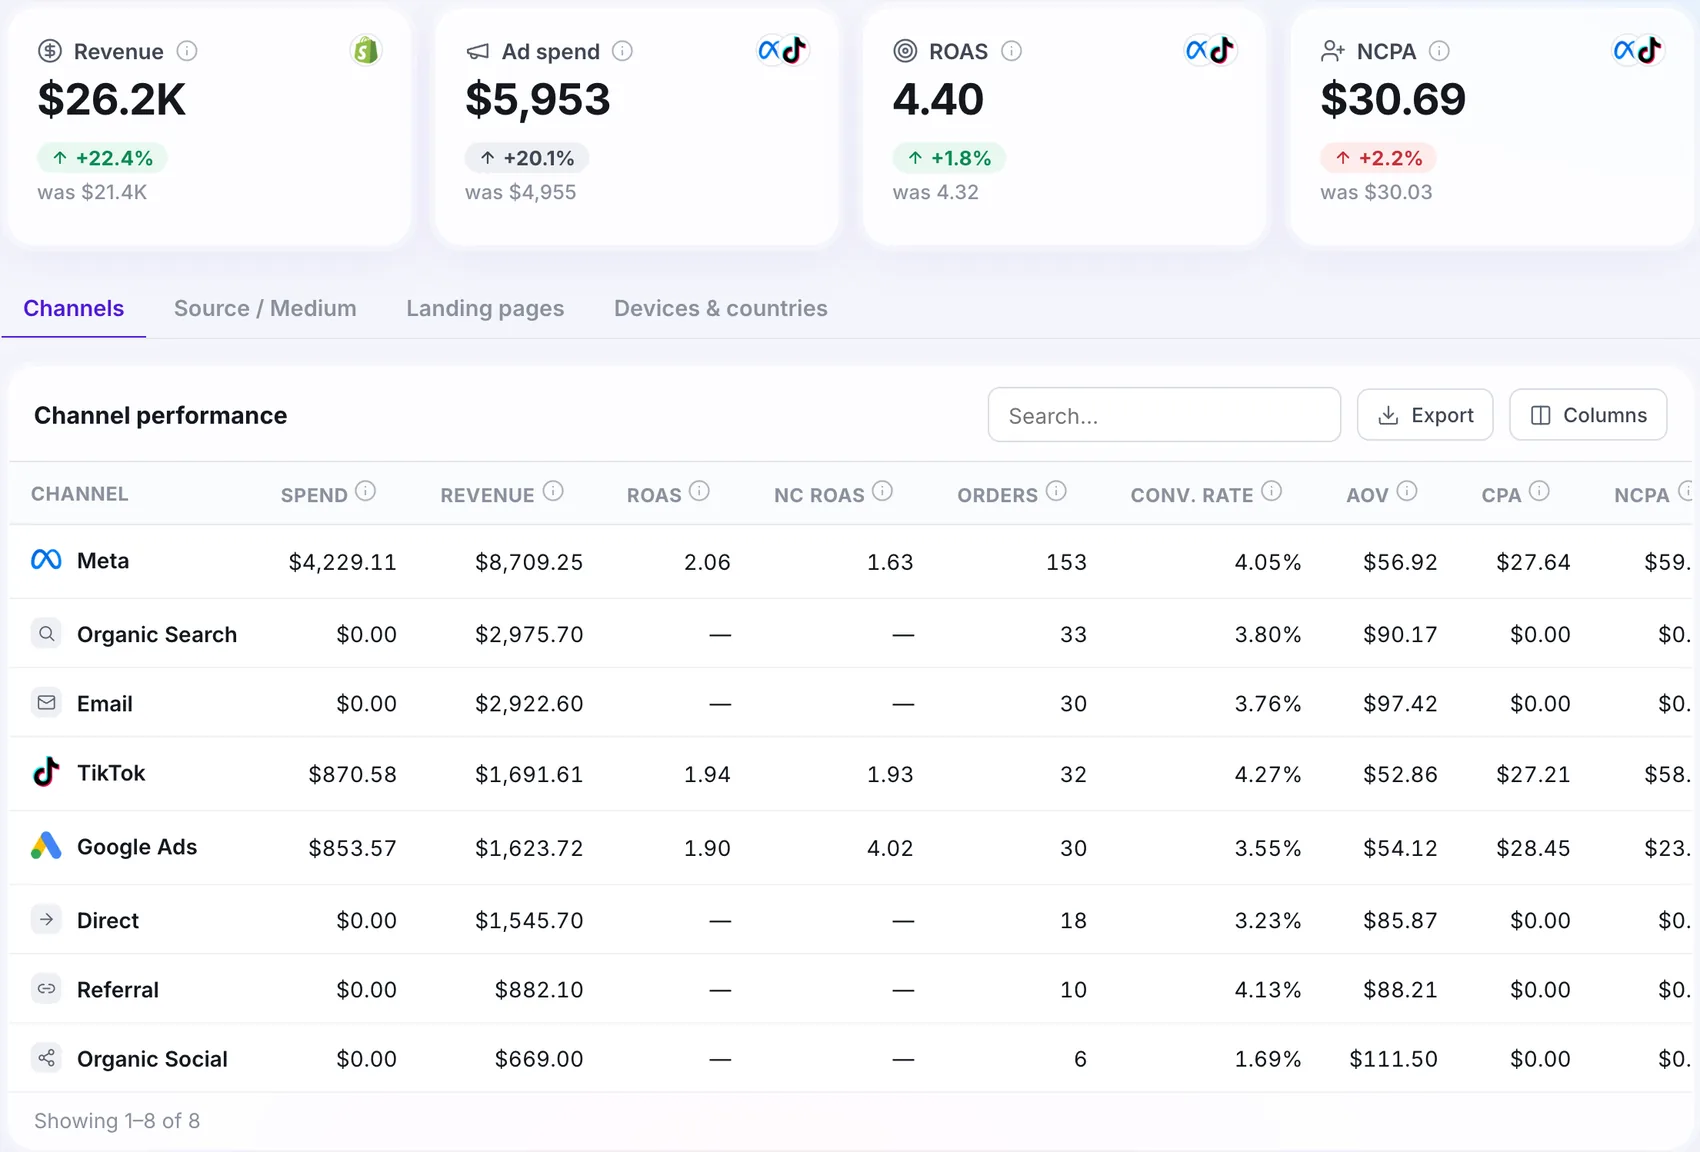
Orders, customers, ad spend, ROAS and profit on one screen, with the change against the last period. No spreadsheets.
Free plan available. No card needed to start.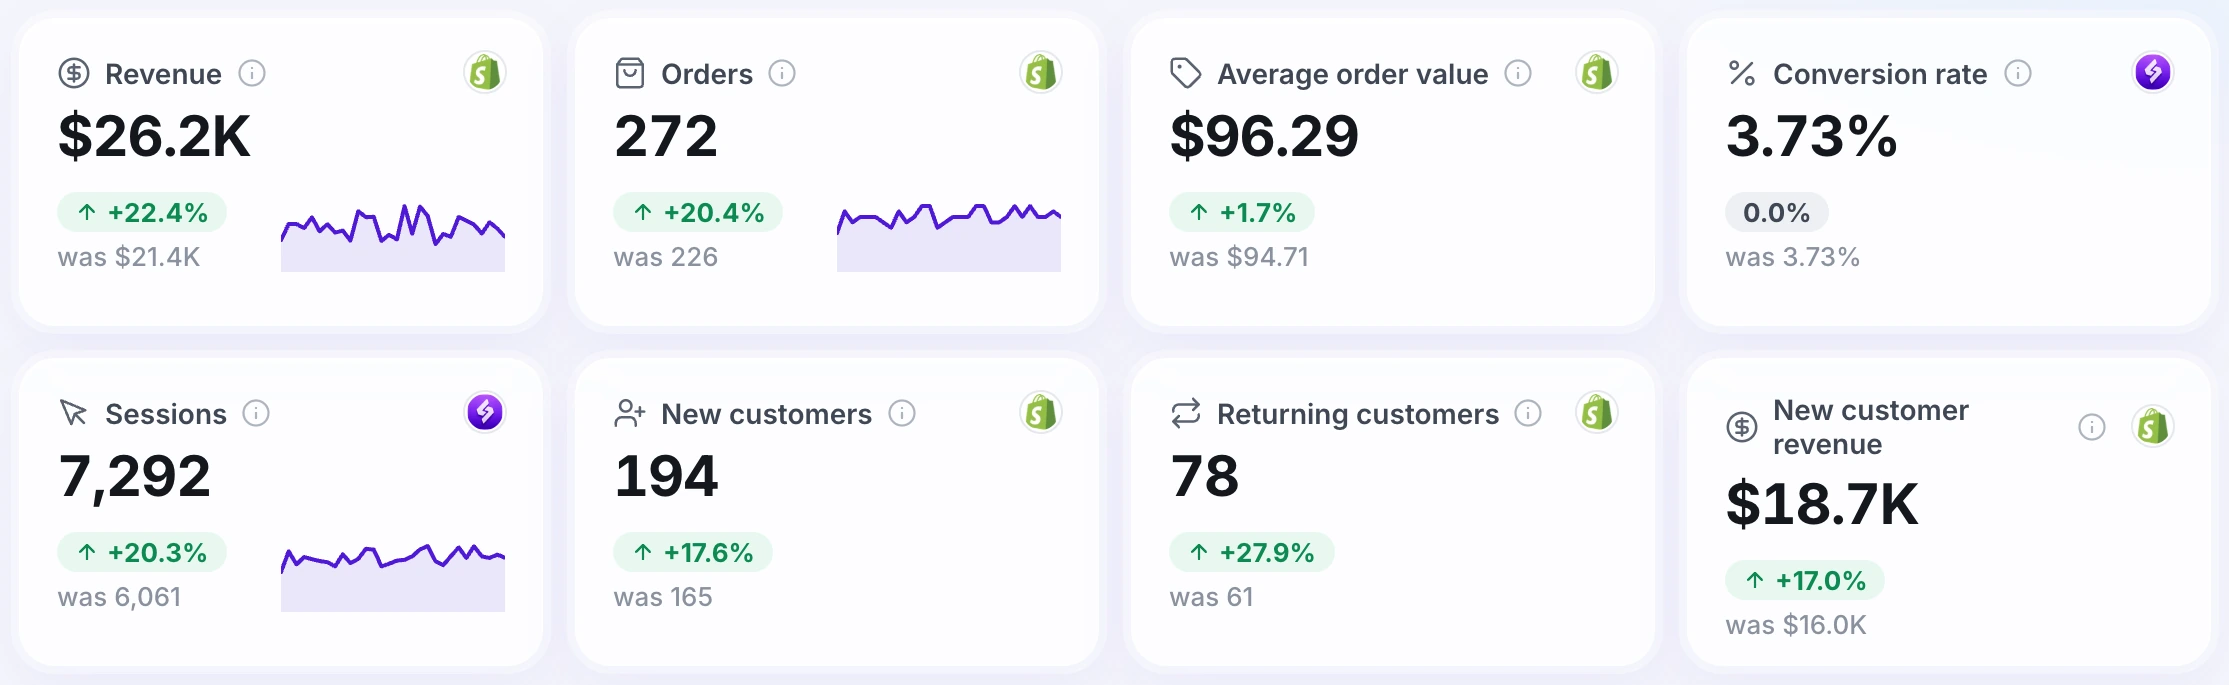
Works with your stack











See what you are missing
How much is your tracking missing?
Put in your own numbers. This is an estimate, not a promise.
Most stores do not know this number. Start with 20% and compare it with the orders in your store.
That is the signal Meta and Google are missing when they decide who to show your ads to. Server-side tracking sends it back.
How it works
Your orders
Revenue, orders and customers from your store.
Your costs and ad spend
Ad platforms and your cost settings.
One overview
ROAS and profit, with the change against the last period.
Why use the dashboard
No spreadsheets
Spend, revenue and profit are read from the same data.
Real profit
Costs from your settings are taken off, so a busy day that lost money does not look good.
The same numbers for everyone
Owners, media buyers and agencies read the same figures.
Trends at a glance
See how every number moves across the period you pick.
Step by step
Start with profit
Is it up or down against the last period?
Look at the channels
Which channel moved the number?
Check the funnel
Where do visitors drop out on the way to a purchase?
Open the details
Go to creatives or acquisition for the reason behind a change.
What you need to get started
On the overview
- Revenue, orders, customers, ad spend, ROAS
- Marketing efficiency and profit
- Trends, top channels, conversion funnel, live orders
What you need
- Orders sent through Open Tracked
- Ad spend from connected platforms or your cost settings
Built for your needs
Owners and marketers
- Want one place for the answer to "are ads paying?"
- Read profit, not only revenue
Agencies
- Report the same numbers to every client
- Skip the monthly spreadsheet
At a glance
Quick answers
Where does ad spend come from?
From the ad platforms you connect and from the daily spend you enter in the cost settings.
Can I pick the date range?
Yes. Every report has a date range at the top, and the numbers show the change against the previous period.
Is profit included on every plan?
Profit and finance are part of the analytics plans, which start at 500 tracked orders a month.
 Platform · 3 min read